Debugging: Configure VS Code + XDebug + PHPUnit

I've lost track of how many hours I have spent trying to configure and use Xdebug. The process usually begins with me noticing how often I've been using dd() while re-running my PHPUnit tests. I think to myself, "There has to be a better way." The next thing I know, I'm researching Xdebug blog posts, reading the documentation, and getting frustrated that I still can't get it to work. Hours later, I end up closing my open browser tabs and going back to littering my codebase with dd(). Except now, with a bruised ego.
Don't get me wrong, dd() is a wonderful tool that I will continue to use. However, there are instances where a real debugging setup can improve my efficiency tenfold. Using Xdebug, I can step through code while watching values change without having to add a single dd() entry and without the need to run the tests multiple times. The cost and time savings add up quickly! There have also been occasions where, in the process of stepping through client code, I find myself in Laravel's core code. I am usually enlightened with the inner workings of Laravel, which is an added benefit.
Why don't more developers use Xdebug in their development workflow?
From my experience, many developers don't fully understand the Xdebug architecture and its use cases. Xdebug is incredibly powerful and has many underutilized features. (You can read about all of the Xdebug features here.) In this post, though, I'm focusing on one specific feature called Remote Debugging (a misleading name since we can debug just fine without a remote system).
You can trigger Remote Debugging in two ways:
- Via the Browser
- Via the Command Line
Almost all of the resources I have come across for using Xdebug cover the first use case, via the browser. However, I want to use it in the terminal by running PHPUnit tests. After many hours of stumbling around, I found the configuration that works to use Xdebug Remote Debugging with one of the more popular editors out today, Visual Studio Code.
If you're using Laravel Homestead to develop locally, you may want to read this post to get started.
Getting Configured: Let's Do This!
We will need to configure the Xdebug PHP Extension, Visual Studio Code, and your Terminal for this to work. These steps assume that you are running tests on the same machine that you are editing with.
Xdebug
1. Install the Xdebug PHP Extension.
For MacOS users, you can easily install the Xdebug extension for your version of PHP using Homebrew. If you're using PHP 7.1, you can run:
brew install php71-xdebug
For other platforms, you can read about how to install Xdebug here.
2. Find the path to your ext-xdebug.ini file by running:
php --ini
The output should look like this:
Configuration File (php.ini) Path: /usr/local/etc/php/7.1
Loaded Configuration File:         /usr/local/etc/php/7.1/php.ini
Scan for additional .ini files in: /usr/local/etc/php/7.1/conf.d
Additional .ini files parsed:      /usr/local/etc/php/7.1/conf.d/ext-igbinary.ini,
/usr/local/etc/php/7.1/conf.d/ext-mcrypt.ini,
/usr/local/etc/php/7.1/conf.d/ext-mongodb.ini,
/usr/local/etc/php/7.1/conf.d/ext-xdebug.ini,
/usr/local/etc/php/7.1/conf.d/php-memory-limits.ini
3. Open ext-xdebug.ini to make sure the extension is loaded, and enabled.
It should look like this:
[xdebug]
zend_extension="/usr/local/opt/php71-xdebug/xdebug.so"
xdebug.remote_enable=1
For CLI Remote Debugging, these are all the configuration settings we need in the ext-xdebug.ini file.
Visual Studio Code
1. Install the PHP Debug plugin.
2. Open the debug panel.
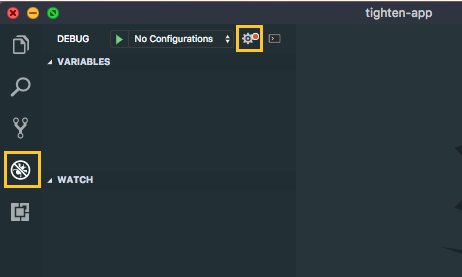
3. Click on the "config" button (the cogwheel) and select PHP.
There is no need to modify the default launch.json file.
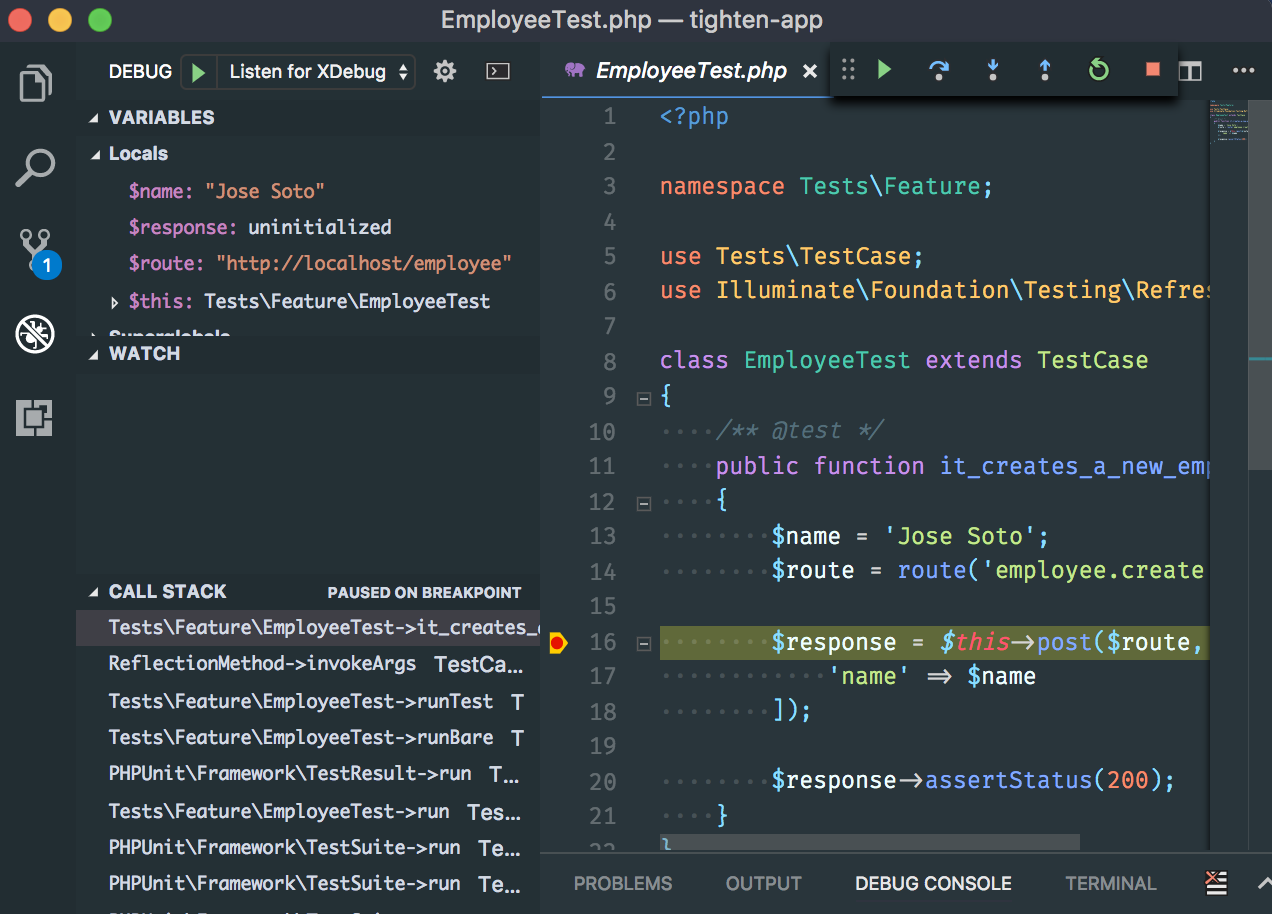
4. Open a PHPUnit test file and set a breakpoint using the debugger plugin.
5. Set the debugger to Listen for Xdebug.
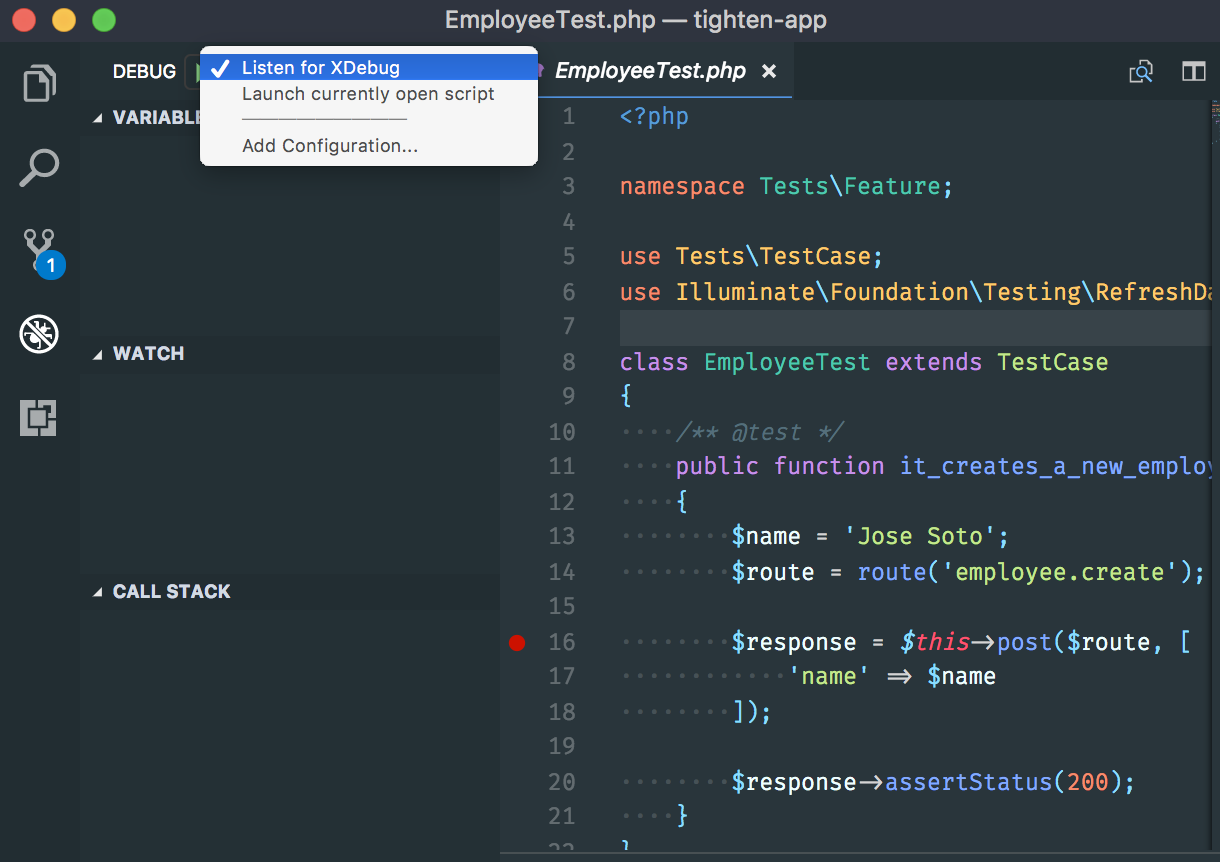
6. Start Debugging by clicking on the green arrow button.
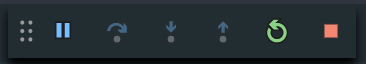
This doesn't actually start the debugging process, but it starts a listener that will be triggered once you run the PHPUnit test.
You should now see a step toolbar with the blue arrow buttons greyed out:
Terminal
Create an environment variable for XDEBUG_CONFIG and set the value to 'idekey=VSCODE'.
This variable flag will inform the Xdebug listener that the script is running. You can do this in one of two ways:
Export Command
Running this export command will create an environment variable for the current terminal session. It will revert once the session is complete.
export XDEBUG_CONFIG="idekey=VSCODE"
- or - Modify your .bashrc/.zshrc file. (Preferred)
This is a more permanent solution for setting terminal environment variables:
- open
~/.bashrcor~/.zshrc. - insert the line
export XDEBUG_CONFIG="idekey=VSCODE". - save and close the file.
- run
source ~/.bashrcorsource ~/.zshrcto pick up your changes.
Debug!
You're now ready to run your test:
phpunit --filter some_test_name
Visual Studio Code should display the first breakpoint and the toolbar will allow you to step through your code.
This is just scratching the surface.
Xdebug is a powerful tool that can be intimidating to use at first—hopefully, this post will help reduce the barrier to entry for proper debugging. By doing so, you can harness a small sliver of Xdebug's power, become a more efficient developer, and gain the confidence to delve deeper into Xdebug if you choose to do so.
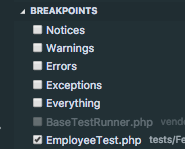
A quick note: If you are using the VSCode-PHPUnit plugin to run your tests, the debugger may be set to hit more breakpoints than you expected. To resolve this, you can uncheck the "Everything" option in the debug panel:
Happy Debugging!!
We'd love to hear your feedback! Tweet @JoseCanHelp and @TightenCo.
in your inbox:
let’s talk.
Thank you!
We appreciate your interest.
We will get right back to you.