Improving Google Maps Performance on Large Datasets

If you've ever built an app that plots data on a map, you've probably noticed that performance tends to slow down as your dataset grows larger. Zooming out too far causes thousands of map markers to display, slowing your map to a crawl, or perhaps your data is so dense that overlapping markers make even small areas hard to interact with.
In this post, I'll cover several techniques you can use to improve the performance of maps with large datasets. I'll be using Google Maps and Vue, but most of these concepts will apply to other map providers and frameworks.
To start, let's pretend we're building an application that displays a map of homes for rent across the country. First we'll create a Vue component for our map. Here's an example:
App.js
import Vue from 'vue';
import * as VueGoogleMaps from 'vue2-google-maps';

Vue.use(VueGoogleMaps, { ... });
Vue.component('my-map', require('./components/MyMap.vue').default);

const app = new Vue({
  el: '#app',
});
MyMap.vue
<template>
  <GmapMap
    :center="{lat: 37.09024, lng: -95.712891}"
    :zoom="7"
    ref="googleMapRef"
    style="width: 800px; height: 500px"
  >
    <GmapMarker
      :key="index"
      v-for="(m, index) in markers"
      :position="m.position"
      @click="center=m.position"
    />
  </GmapMap>
</template>

<script>
import { gmapApi as googleMapsApi } from 'vue2-google-maps';

export default {
  props: {
    homes: {
      default: [],
      type: Array,
    }
  },
  data() {
    return {
      markers: [],
      map: null,
    };
  },
  computed: {
    google: googleMapsApi,
    mapReady() {
      return this.google && this.map !== null;
    }
  },
  watch: {
    mapReady(value) {
      if(! value ) return;

      this.plotMarkers();
    }
  },
  methods: {
    plotMarkers() {
      if (!this.homes.length || this.markers.length) return;

      this.markers = this.homes.map(home => {
        let marker = {
          position: {
            lat: parseFloat(home.latitude),
            lng: parseFloat(home.longitude)
          },
        };

        return marker;
      });
    }
  },
  mounted() {
    this.$refs.googleMapRef.$mapPromise.then((map) => {
      this.map = map;
    });
  },
};
</script>
Quick Note: I am using the vue2-google-maps library here which provides a great, ready to use Google Maps component. It also provides access to the
Mapinstance – both of which will be very important later. Don't worry too much about the particulars of this component. We'll be primarily focused on updating the code within ourplotMarkersmethod.
As it stands, our test data is currently returning 2,000 records that we pass into our component through its homes prop. In the plotMarkers method, we map over those homes, create a map marker for each, and add them to our map component.
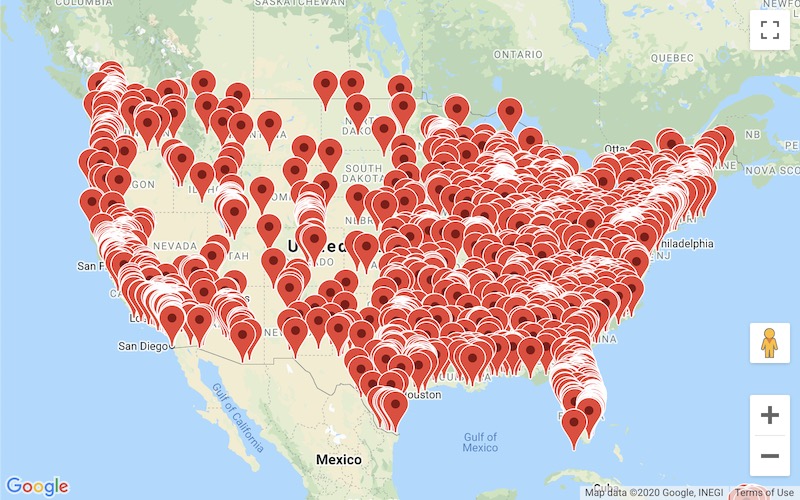
Use Raster Images for Custom Marker Icons
This first tip comes straight from the Google Maps Platform list of best practices. Whenever you're using custom images for your markers, it's recommended to stick to raster images (.jpg, .jpeg, .png) instead of Scalable Vector Graphics (.svg). The Google Maps library provides built-in optimizations for rendering raster image markers, which will minimize any map tile rendering lag as a user pans and zooms on the map.
Taking advantage of this optimization would be beneficial for us since we're displaying thousands of homes at once.
Let's update our code to specify a custom image for our markers. To do so, we'll add an icon property to the marker object we defined in our plotMarkers method:
this.markers = this.homes.map(home => {
  let marker = {
    position: {
      lat: parseFloat(home.latitude),
      lng: parseFloat(home.longitude)
    },
    icon: {
      url: '/img/house-icon.png',
    },// [tl! add:-2]
  };

  return marker;
});
We'll also update the GmapMarker component to accept our icon as a prop:
<GmapMarker
  :key="index"
  v-for="(m, index) in markers"
  :position="m.position"
  :icon="m.icon"
  @click="center=m.position"
/><!-- [tl! add:-2,1] -->
If you're using an SVG icon as the source for your raster image, here's a quick hack for maintaining the icon's crispness during conversion – save your SVG out at two times its size using a program like Sketch or Figma. After exporting, use a tool like ImageOptim to create the smallest possible lossless version of your image (using too large of an image might hurt your map's performance). Then, back in the code, you can use the scaledSize property on the icon associated with your marker object to size your marker appropriately. For example:
icon: {
  scaledSize: new this.google.maps.Size(18, 18),
  url: '/img/house-icon.png',
},<!-- [tl! add:-2,1] -->
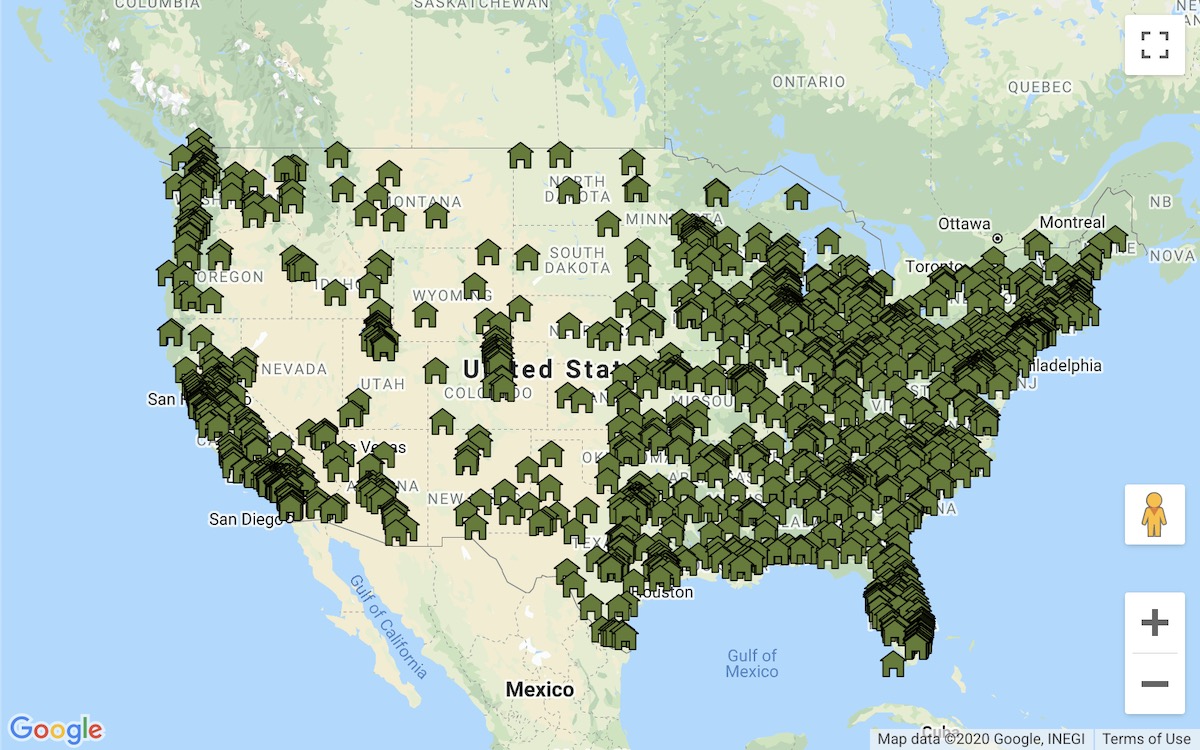
Now that we've got that set, let's go a step further. The overcrowding of the markers makes this map unusable unless the user zooms in, but no worries! The next section outlines how we can make this better.
Group Markers Using a Clusterer
MarkerClustererPlus is a library provided by the Google Maps Platform team that we can use in combination with the Maps JavaScript API to group markers in close proximity. The clusters themselves are created and managed based on the zoom level of the map. As you zoom out, the map will consolidate the markers into these clusters that will display a number indicating how many markers it contains. Zooming in decreases the number of clusters formed, and individual markers are displayed again.
Adding the clusterer library to our map is simple. First, we need to install the package via npm:
npm i @googlemaps/markerclustererplus
Next, we can import the library in our app.js file:
import Vue from 'vue';
import * as VueGoogleMaps from 'vue2-google-maps';
import MarkerClusterer from '@google/markerclustererplus';// [tl! add]
Instead of our markers being added directly to the map, we’ll initialize our clusterer object and add the markers to it inside of the plotMarkers method. Doing so allows us to reduce the template returned from the MyMap component down to the Google Map itself:
<template>
  <GmapMap
    :center="{lat: 37.09024, lng: -95.712891}"
    :zoom="7"
    ref="googleMapRef"
    style="width: 800px; height: 500px"
  ><!-- [tl! remove:7] -->
    <GmapMarker
      :key="index"
      v-for="(m, index) in markers"
      :position="m.position"
      @click="center=m.position"
    />
  </GmapMap>
  /><!-- [tl! add] -->
</template>

<script>
import { gmapApi as googleMapsApi } from 'vue2-google-maps';

export default {
  data() {
    clusterer: null, // [tl! add]
    markers: [],
    map: null,
  },
  methods: {
    plotMarkers() {
      if (!this.homes.length || this.markers.length) return;

      this.markers = this.homes.map((home) => {
        let marker = new this.google.maps.Marker({
          position: {
            lat: parseFloat(home.latitude),
            lng: parseFloat(home.longitude),
          },
          icon: {
            url: "/img/house-icon.png",
            scaledSize: new this.google.maps.Size(18, 18),
          },
        });

        return marker;
      });
    // [tl! add:1,9]
      this.clusterer = new MarkerClusterer(this.map, [], {
        imagePath:
          "https://developers.google.com/maps/documentation/javascript/examples/markerclusterer/m",
      });

      this.google.maps.event.addListener(this.map, "tilesloaded", () => {
        this.clusterer.clearMarkers();
        this.clusterer.addMarkers(this.markers);
      });
    },
  },
}
</script>
Ahhh, much better!
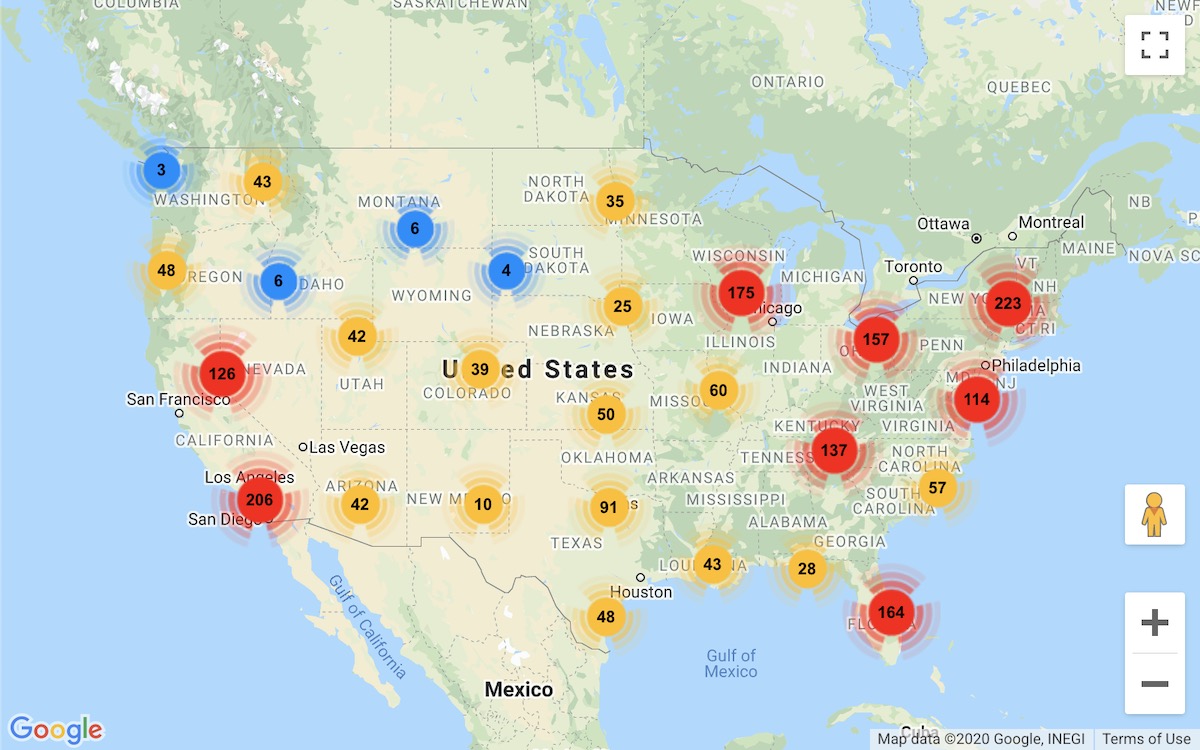
This particular optimization is a must for maps that display a large number of markers. Not only is it a great way to help your map's performance, but it makes the visual representation of a larger dataset less challenging to parse. You can read more about configuring when and how your clusters render in the Maps JavaScript API documentation. If you decide to use custom icons to represent clusters on the map, the same tips outlined for custom marker images will apply.
Only Plot Markers for Data Within the Current Bounds
This tip might seem obvious, but it can be easy to forget and just as easily kill performance. Our map object gives us access to a getBounds method on the current instance that allows us to determine the visible portion of the map based on its position and zoom level. Since we'll already have access to all of the markers we defined and saved to state, we can update our call that adds the markers to our clusterer object to only include those whose current position is within the map's current bounds. Doing so will significantly reduce the amount of data added to the map on the first render.
export default {
  data() {
    clusterer: null,
    currentMarkers: [],// [tl! add]
    markers: [],
    map: null,
  },
  methods: {
    plotMarkers() {
      if (!this.homes.length || this.markers.length) return;

      this.markers = this.homes.map((home) => {
        let marker = new this.google.maps.Marker({
          position: {
            lat: parseFloat(home.latitude),
            lng: parseFloat(home.longitude),
          },
          icon: {
            url: "/img/house-icon.png",
            scaledSize: new this.google.maps.Size(18, 18),
          },
        });

        return marker;
      });

      this.clusterer = new MarkerClusterer(this.map, [], {
        imagePath:
          "https://developers.google.com/maps/documentation/javascript/examples/markerclusterer/m",
      });

      this.google.maps.event.addListener(this.map, "tilesloaded", () => {
        this.clusterer.clearMarkers();
        this.clusterer.addMarkers(this.markers);// [tl! remove]
        this.clusterer.addMarkers(this.currentMarkers = this.markers.filter(marker =>
          marker.getVisible() && this.map.getBounds().contains(marker.getPosition())
        ));// [tl! add:-3]
      });
    },
  },
}
Alternatively: Return Initial Data Within a Specified Radius
Let's switch gears and change our application's purpose to be one that displays a map of nearby homes for rent to your user based on their location. Assume that we've updated our code to retrieve the user's current location when our map component is mounted. We can post those coordinates to an endpoint in Laravel, using Axios, for example, that will only return homes within an x mile radius from the user.
To do this, let's add a nearLocation scope to our Home model that will take in a latitude and longitude. In this scope, we can use the MySQL distance function, ST_Distance_Sphere, to do the heavy lifting of finding the homes to show our user. In the example below, we're restricting the homes returned to be within 100 miles of the provided location.
Logan Henson gives a great overview of the
ST_Distance_Spherefunction in this post here. I encourage you to check it out if you haven't already.
Home.php
<?php

namespace App\Models;

use Illuminate\Database\Eloquent\Model;
use Illuminate\Database\Eloquent\Builder;

class Home extends Model
{
    public function scopeNearLocation(Builder $query, $latitude, $longitude)
    {
        return $query->whereRaw('
            ST_Distance_Sphere(
                point(longitude, latitude),
                point(?, ?)
            ) * 0.000621371192 < 100 // desired delivery max range
        ', [
            $longitude,
            $latitude,
        ]);
    }
}
Here's an example of a single-action controller that returns our results to the frontend:
GetNearbyHomesController.php
<? php

namespace App\Http\Controllers;

use App\Models\Home;

class GetNearbyHomesController extends Controller {
    public function __invoke()
    {
        return response()->json([
            'homes' => Home::nearLocation(
                request('latitude'),
                request('longitude'),
            )->get(['latitude', 'longitude']),
        ]);
    }
}
Note: For the best user experience, allow the user to pick the mile radius they'd like to restrict their results to and pass that into the request along with their location.
Bonus: Access Individual Markers With the Same Coordinates
While Marker Clustering provides a great solution for grouping markers in close proximity, there is no out of the box solution provided by the Google Maps API that handles interacting with markers with the same coordinates. No matter how close you zoom in, you'll always see just one marker with the others hidden beneath it. Any events registered to the markers will only apply to the topmost marker in the stack. So how can you reveal the remaining markers?
Overlapping Marker Spiderfier to the Rescue
Disclaimer: At the time of writing this post, Overlapping Marker Spiderfier has not been actively contributed to, but is a great starting point should you decide to fork it and add additional features or try your hand at contributing to the original!
Overlapping Marker Spiderfier, or OMS, is a cool open-source package that will add enhanced listeners to your map allowing overlapping markers to spring apart when the topmost marker in the stack is clicked. Luckily for us, OMS plays very nicely with the clustering we have included, too. Let's add it to our example code to see it in action.
First, we'll add a script tag to our main view file with the link to the package file's minified version. Alternatively, you may download a compiled, minified version of the package from the OMS Github page and host the file yourself.
<script src="https://cdnjs.cloudflare.com/ajax/libs/OverlappingMarkerSpiderfier/1.0.3/oms.min.js"></script>
Note: Feel free to pause here to read the package's documentation to see the available configuration options.
Next, we'll update our map component to set the initial values and options of our OMS object:
export default {
  data() {
    return {
      clusterer: null,
      currentMarkers: [],
      markers: [],
      map: null,
      spiderfier: null,
      spiderfierOptions: {
        basicFormatEvents: true,
        circleFootSeparation: 40,
        keepSpiderfied: true,
        markersWontHide: true,
        markersWontMove: true,
      },// [tl! add:-7]
    };
  },
}
Then we'll revisit our plotMarkers method, create a new instance of OMS, and track each of our markers with it:
methods: {
  plotMarkers() {
    if (!this.homes.length || this.markers.length) return;

    this.spiderfier = new OverlappingMarkerSpiderfier(this.map, this.spiderfierOptions);// [tl! add]
    this.markers = this.homes.map((home) => {
      let marker = new this.google.maps.Marker({
        position: {
          lat: parseFloat(home.latitude),
          lng: parseFloat(home.longitude),
        },
        icon: {
          url: "/img/house-icon.png",
          anchor: new this.google.maps.Point(7.5, 7.5),// [tl! add]
          scaledSize: new this.google.maps.Size(18, 18),
        },
      });

      this.spiderfier.trackMarker(marker);// [tl! add]

      return marker;
    });

    // ...
  },
},
Our last step here to get this working is very important. We'll return to the code that creates a new instance of our clusterer object and pass in a new option limiting the max zoom level. Without this limit, no matter how far into the map the user zooms, the cluster will always appear in cases where two or more markers are at the same point. To see OMS in action when we click the markers, we set the max zoom level so that this is not the case.
  methods: {
    plotMarkers() {
      // ...

      this.clusterer = new MarkerClusterer(this.map, [], {
        imagePath:
          "https://developers.google.com/maps/documentation/javascript/examples/markerclusterer/m",
        maxZoom: 16,// [tl! add]
      });
    },
  },
And there you have it! In the example below, you can see that we have a cluster of three homes in the same location.
When the cluster is clicked, the map zooms in at a level beyond where the clustering can happen, thanks to our new maxZoom restriction. Once zoomed in, clicking the marker reveals all of the homes at that location.
Hopefully these tips have helped you improve your maps' performance. If you have questions or want to share your own mapping tips, you can find me at @nadrarvre on Twitter.
in your inbox:
let’s talk.
Thank you!
We appreciate your interest.
We will get right back to you.